A higher published rate is a lead to investigate. It is not yet evidence to bring into a payer negotiation.
For a managed care leader, the useful question is not simply, “Can we find someone with a higher rate?” It is, “Can we explain why this comparison applies to our organization, our services, and the agreement we are negotiating?”
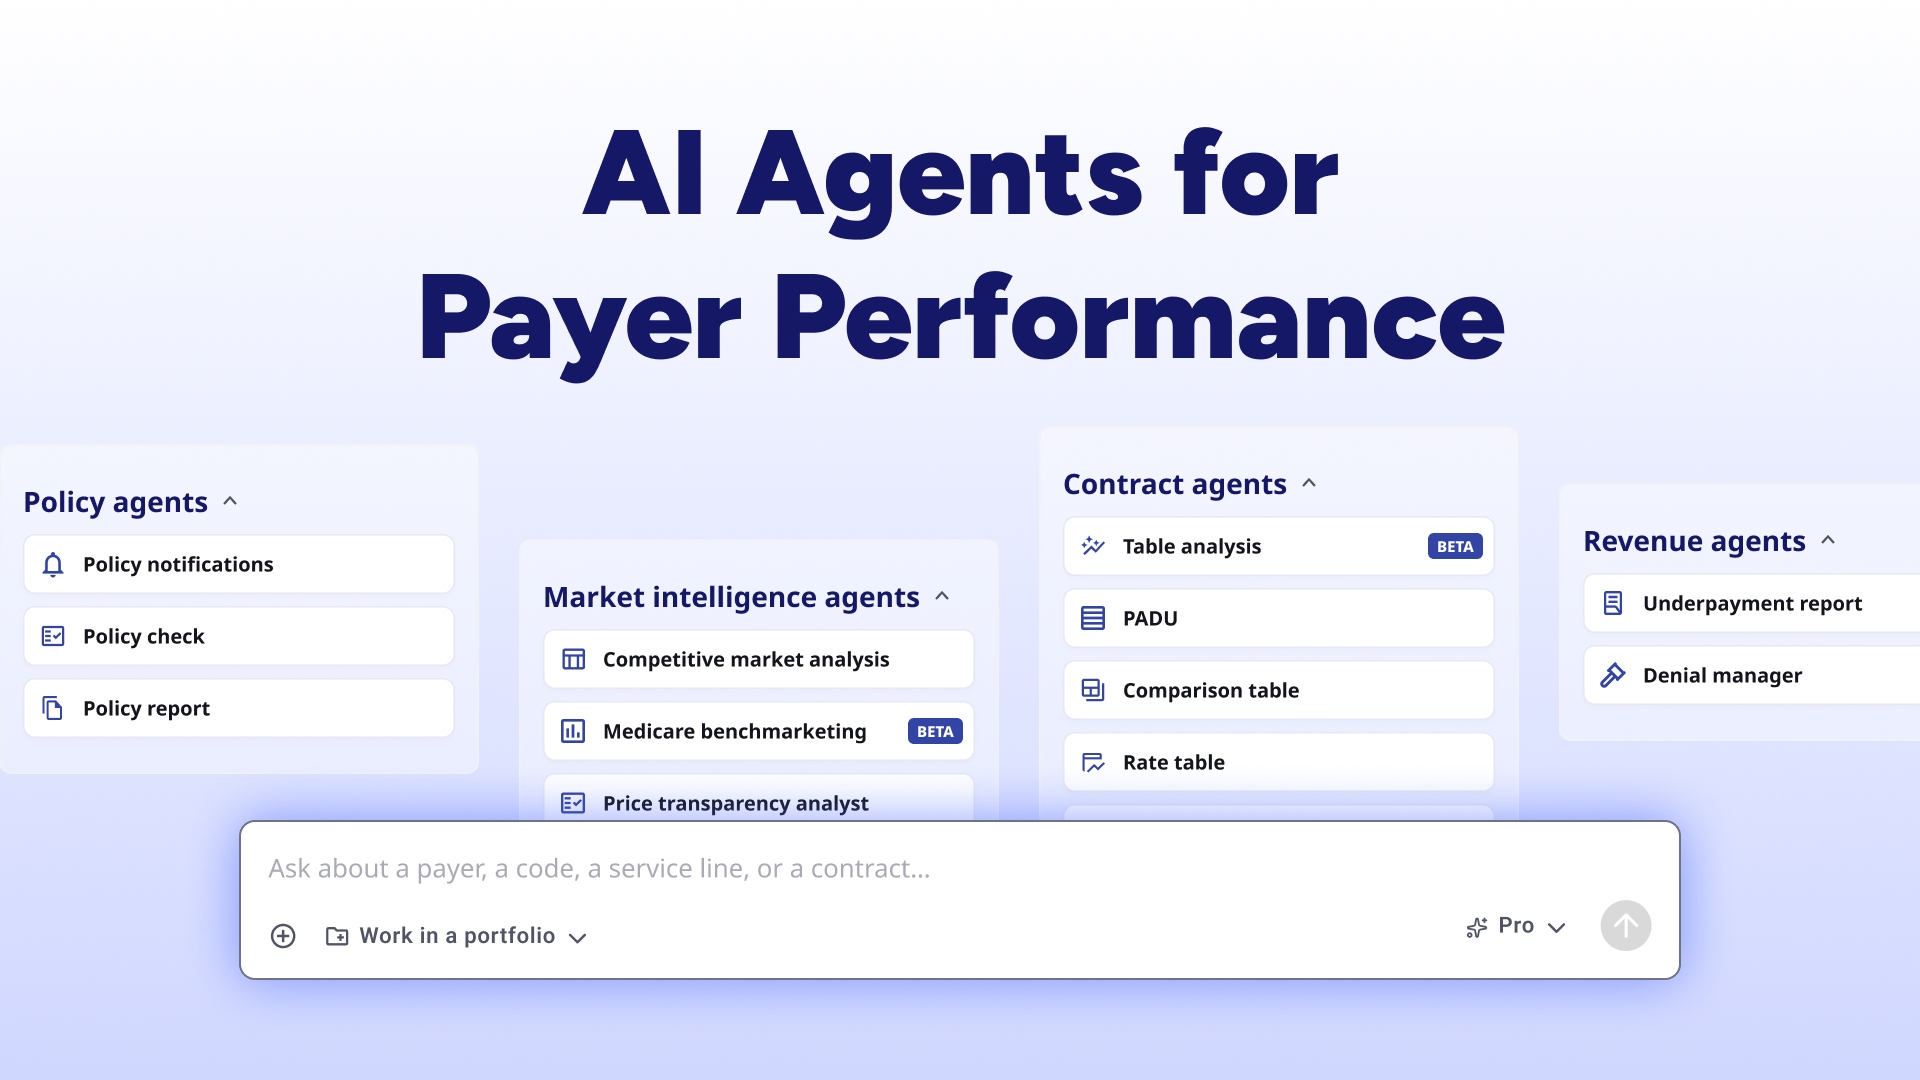
Earlier this week, we introduced Trek Health’s Market Intelligence AI agents in The Last Mile of Price Transparency. They are designed to take on the research behind those questions, bringing together price transparency data, provider relationships, and Medicare benchmarks.
Here is what that work involves. Using Trek’s underlying data, we investigated one orthopedic procedure, one payer, and a defined Northern California market. The investigation changed which rates belonged in the comparison and what the evidence could support.
Start with the decision, not the biggest number
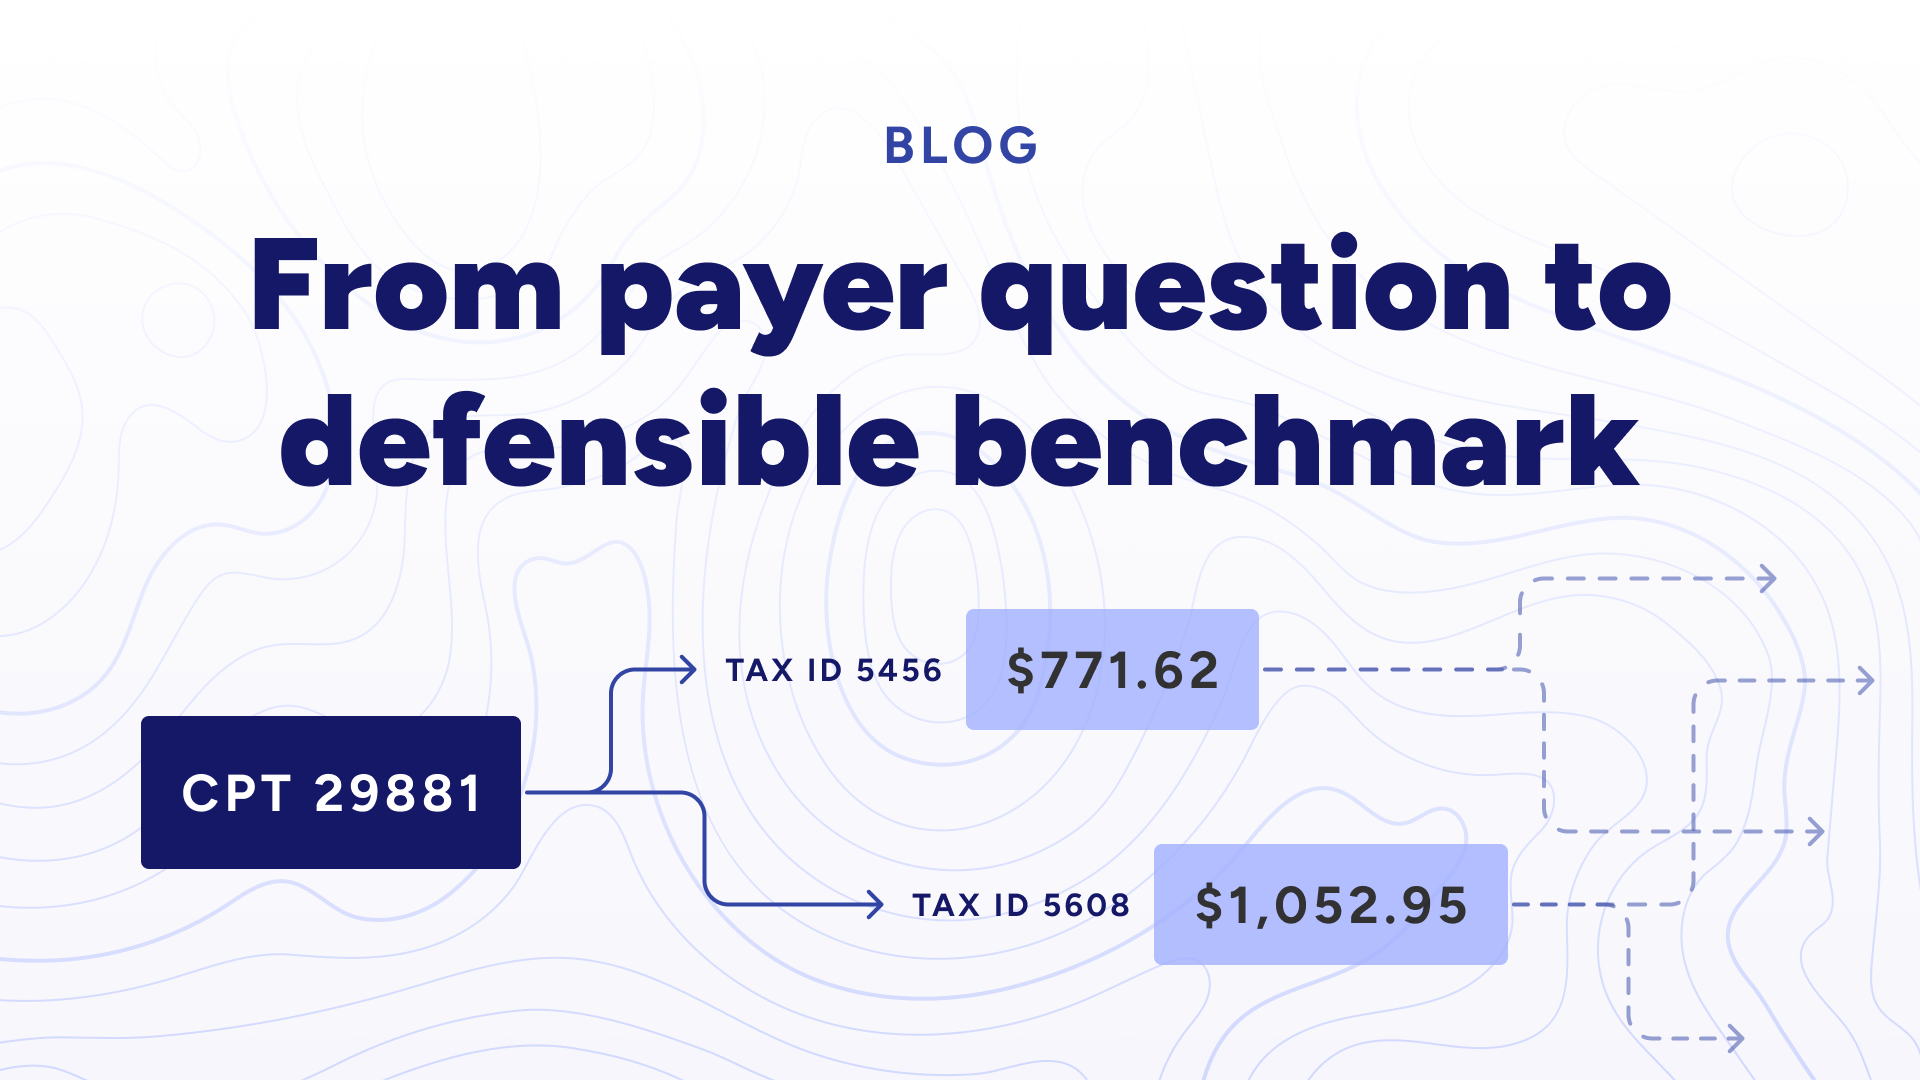
The question was familiar: “How do this orthopedic group’s UnitedHealthcare rates compare with similar providers in its market?” We narrowed the analysis to CPT 29881, a knee arthroscopy procedure involving meniscectomy, rather than treating an entire orthopedic agreement as one benchmark (CMS procedure reference).
The scope was professional dollar rates, no populated modifier, active organizational NPIs registered under orthopedic-surgery specialties, and practice locations in a nine-city East Bay market. That meant excluding facility fees, total episode costs, and actual claims payments from the question.
This scope is important before any rate is retrieved. Otherwise, a comparison can appear precise while answering a different business question.
Investigate the provider relationship before assigning the rate
The initial provider-level coverage lookup was empty for the local organizational cohort. Following the tax-ID lookup path surfaced two amounts attached to the same nine organizational NPIs in Trek’s processed data: $771.62 and $1,052.95, under different tax IDs.
It would have been easy to average them, choose the higher amount, or describe them as two contracts for the same practice. None of those conclusions was established by the shared NPIs.
Separate entity research supported using the $771.62 observation as a working reference for the subject group’s tax ID. The higher amount appeared under a tax ID associated with another organization, so we kept it separate rather than treating it as a second verified rate for the group.
A historical spot-check found the same NPI–TIN pairs and amounts in two quarterly datasets. That established persistence in the processed data, not the reason for the relationship.
The cause of the overlap remains unverified. Distinguishing a legitimate contracting relationship from a stale association or processing issue requires tracing the original provider-reference record and checking the applicable agreement.
The practical lesson is simple: an NPI match is a research path, not a substitute for contract attribution. Entity names from separate research or processed metadata should not be presented as names supplied by the payer.
Build the comparison population before calculating the median
A broader retrieval also surfaced $2,808.87 with the requested payer, procedure code, and professional billing label. But the four attached NPIs were registered in physical therapy, occupational therapy, or physician assistant classifications, not orthopedic surgery in the registry fields checked; these are distinct classifications in the NUCC taxonomy reference.
That amount did not belong in this orthopedic-organization comparison. Excluding it was a scope decision, not a declaration that the amount was wrong.
We then applied the same geography, provider, billing-class, modifier, and dollar-rate rules across the comparison population. We removed two known current affiliations of the subject group and held out three other tax IDs with unresolved multiple amounts, rather than selecting whichever amount made the story more attractive.
The retained population contained 11 other tax IDs representing 14 organizational NPIs. Giving each tax ID equal weight produced:
The working reference was 6.15% above the retained median. That is a finding about this defined comparison, not a market-wide ranking or a conclusion about the entire agreement.
Equal tax-ID weighting prevented an organization with more listed NPIs from automatically dominating the result. It did not substitute for procedure volume, establish identical plan participation, or prove every retained tax ID represented an independent competitor.
Add Medicare without confusing the payment being compared
The next question was whether Medicare changed the interpretation. Because this was a professional-service comparison, we used the Physician Fee Schedule, not an ASC facility payment.
We matched the East Bay geography to Medicare locality 05, which includes Alameda and Contra Costa counties (CMS locality configuration). For CPT 29881 with a blank modifier, the annual 2026 schedules list $609.02 for non-qualifying APM participants and $612.06 for qualifying APM participants, or QPs (CMS carrier files).
¹ Ratios use the corresponding CMS annual 2026 schedule amounts. They are percentages of Medicare, not increases over Medicare or estimates of final claims payments.
For this code and locality, the facility-setting and non-facility-setting professional amounts are identical within each schedule (CMS carrier files). We show both QP and non-QP references because clinician eligibility was not established.
The working reference was above Medicare and above the selected commercial median. Neither fact, by itself, determines whether a contract is adequate or where a negotiation should land.
Challenge the conclusion before using it
Could excluding the three unresolved multi-rate tax IDs have driven the answer? We tested that by adding all three back, first using their lower amounts and then their higher amounts, while keeping known subject affiliations excluded.
The resulting 14-tax-ID medians were $711.92 and $732.77. The $771.62 working reference remained above the median in both scenarios.
That did not validate the unresolved rates. It showed that this particular uncertainty did not reverse the direction of the comparison.
For a managed care leader, the conclusion is more useful than a headline about a large rate gap: this procedure did not establish a below-market case. Before using it in a negotiation, the team would still need to verify contract applicability and determine whether the pattern held across its economically meaningful service mix.
Five questions to ask of your next benchmark
This investigation suggests a practical review standard. Before a number enters a payer presentation, ask your team:
- Attribution: Which NPI–TIN relationship supports this rate, and have we verified that it applies to the agreement in scope?
- Comparability: Are the code, modifier, professional or facility component, payment unit, and service setting aligned?
- Peer selection: Have we excluded our own affiliates, explained the geography, and made the weighting clear?
- Medicare context: Are we using the correct schedule, year, locality, and eligibility assumptions?
- Decision relevance: Does the conclusion survive reasonable alternative selections, and does it matter across our actual service mix and volume?
The point is not to eliminate every uncertainty before doing useful work. It is to know which findings can guide the next decision and which observations still require investigation.
That is the role we described for Trek Health’s Market Intelligence AI agents: delegate the research, not just the lookup. The value is a comparison your team can understand, challenge, and build on, rather than another collection of rates to decipher.
Have a payer negotiation coming up? Bring one payer, one market, and one question to a working session with Trek. We’ll walk through the investigation, what the evidence supports, and what needs verification before it becomes part of your negotiating position.
Research note: Analysis completed September 23, 2026, using accessible UnitedHealthcare Q2 2026 published-rate data in Trek’s backend, a March 2026 NPI registry snapshot, and April 2026 provider mappings. Practice names and identifiers are omitted. Current affiliations were reviewed separately; one affiliation postdated the rate vintage, so this is a current-affiliation comparison using historical rates. Medicare references use annual 2026 carrier files updated December 29, 2025, carrier 01112/locality 05 (CMS release). This is backend research, not a customer outcome study or an observed in-app agent session. It does not establish claim-specific payments, executed contract terms, or achievable rate increases.