By Dilpreet Sahota, Founder and CEO, Trek Health · September 22, 2026
You should not have to become a data engineer to understand your position in a payer negotiation. You should be able to ask a business question and get an answer you can defend.
Consider a question that sounds simple: How do our negotiated rates compare with similar providers in our market?
Before you can answer it, you have to decide which providers belong in the comparison, which identifiers represent them, which rates are actually comparable, and what to do when a payer appears to have no data. Add a Medicare benchmark, and there is another set of decisions before the percentage means anything.
That gap between having the data and being able to use it is what I think of as the last mile of price transparency. It is also why I am so excited about Trek Health’s Market Intelligence agents.
The important change is not that you can type a question instead of clicking through filters. It is that you can delegate the investigation behind the answer.
The work hiding behind a simple benchmark
If you work with price transparency data, these are the kinds of questions that can turn a straightforward request into a research project:
- “Why are there several rates for the same provider and code?” The investigation may need to separate plan products, billing classes, modifiers, places of service, or payment methodologies. Taking an average does not explain the variation.
- “Why can’t I find the organization I know is in this market?” The relevant rates may sit under a facility or affiliated provider’s NPI rather than the identifier you started with. Following the NPI and tax-ID relationships can uncover additional records, but you still have to decide which entities belong in the comparison.
- “Does no result mean no data?” Not necessarily. Our agent’s research instructions include checking UnitedHealthcare’s custom billing-code families when a standard-code search comes back empty, rather than treating the first query as the final answer.
- “Are these even the same kind of rate?” A dollar amount per service, a daily rate, and a percentage of charges need separate comparisons. Combining them can produce a precise-looking number with no useful meaning.
These are not details to clean up after the analysis. They determine what the analysis can legitimately say.
An empty result is a reason to investigate, not permission to invent an answer. Finding a related custom code is useful, but it does not make that code interchangeable with another payer’s standard CPT code.
This is the kind of domain knowledge we encode into Trek’s agents: where to look next, what to keep separate, and when the evidence is insufficient.
“Percent of Medicare” needs an explanation, too
A Medicare percentage can look like the cleanest number in the report. My first question is: What is in the denominator?
For physician services, CMS publishes facility and non-facility amounts and adjusts payment for geographic differences, so selecting the applicable setting and locality matters (CMS Physician Fee Schedule documentation).
The analysis should make those choices visible, along with the applicable year and payment methodology. Otherwise, two people can use the phrase “percent of Medicare” while answering different questions.
That is the standard I want us to hold: do not simply produce the percentage. Explain what it compares, why that comparison fits the question, and where it stops being reliable.
An agent should own the investigation, not just write the query
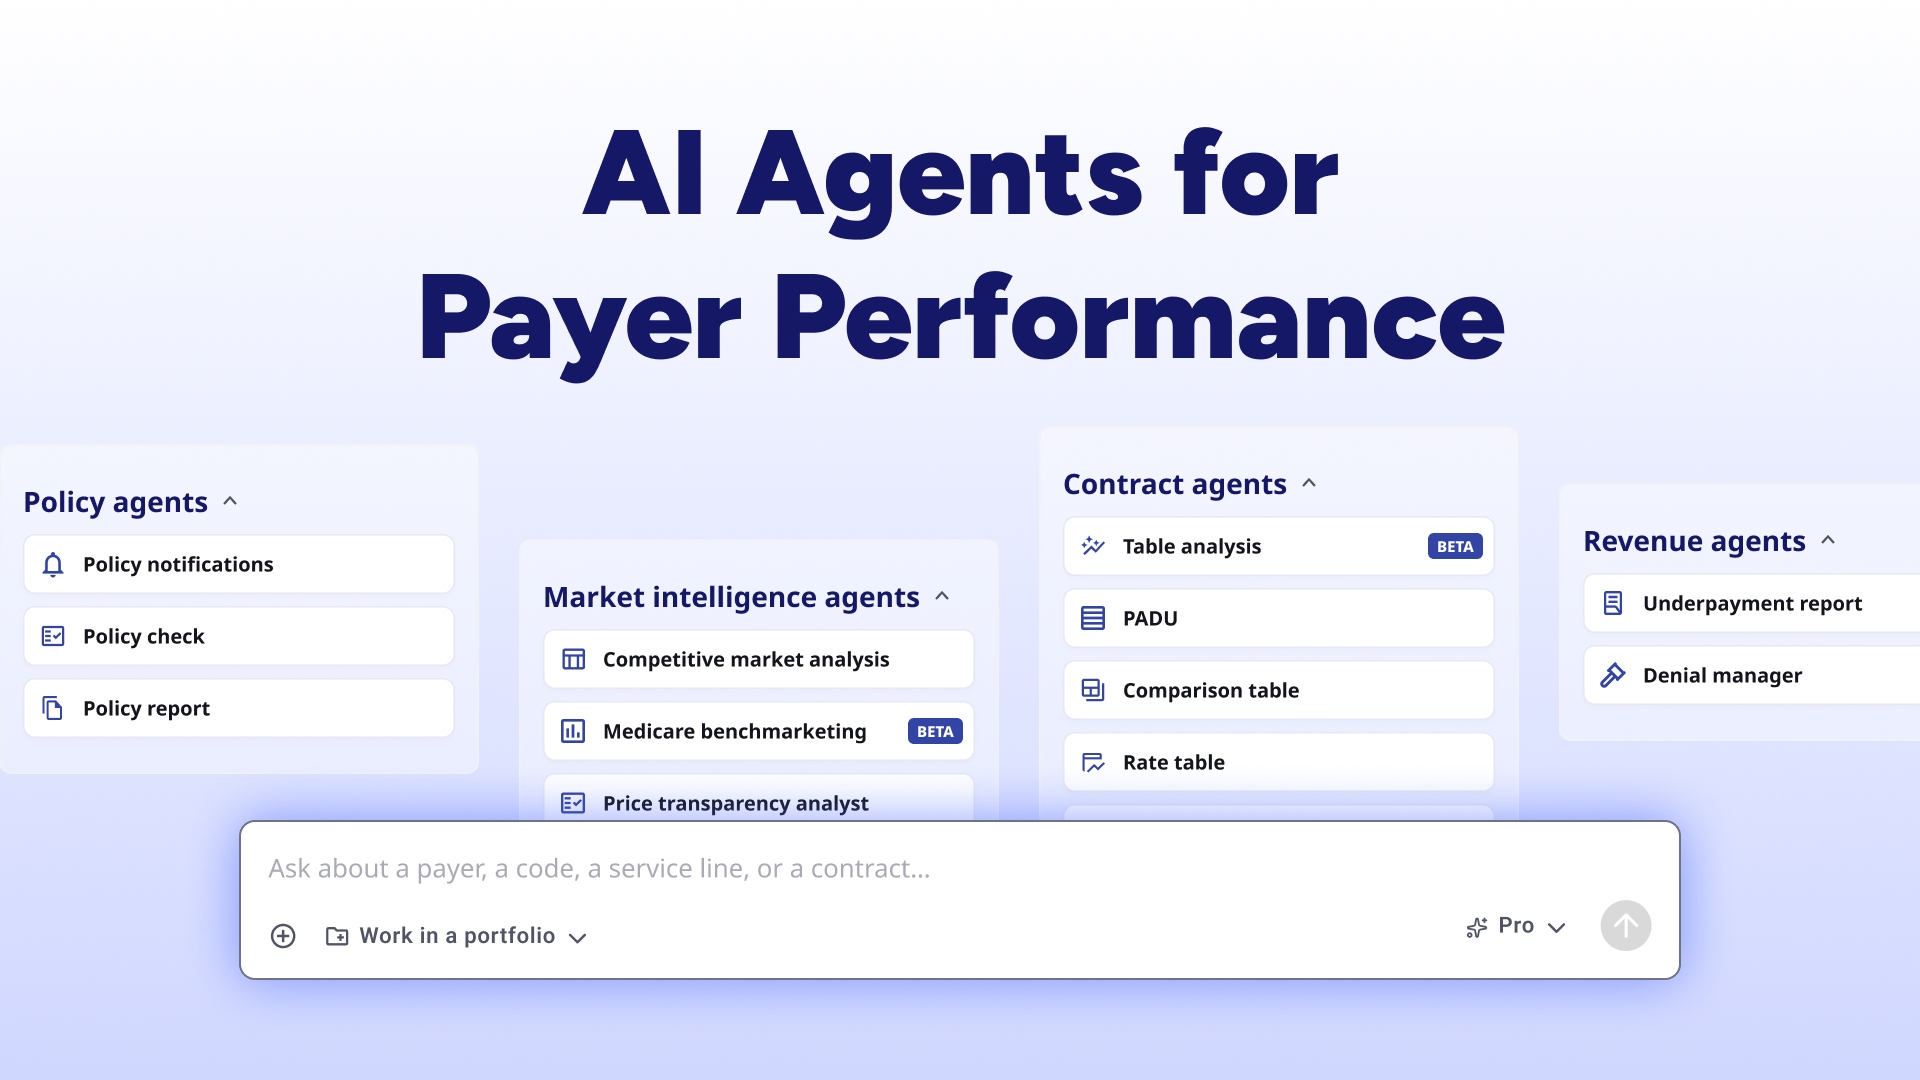
Trek’s Market Intelligence agents can query our SQL database, use web search for supporting context, and work through multiple steps toward a business-ready answer. The database supplies the rates; the research instructions guide how the agent investigates them.
That distinction matters. A system that converts a sentence into one SQL query still leaves the user responsible for knowing whether it asked the right question of the data.
Imagine asking the agent to compare your organization’s negotiated rates with comparable providers in your market. The work is not finished when the first query runs.
The agent needs to resolve the organizations, define the provider cohort, identify the relevant codes and payers, and retrieve comparable rates. When a lookup is empty, it needs to check the relevant alternative identifiers or coding conventions. When multiple rates appear, it needs to investigate their differences rather than hide them inside an average.
Web search has a distinct role in that process. It can help establish supporting context, such as relevant service codes; it should not substitute an internet estimate for a negotiated rate in the database.
The result should explain the market comparison, show the supporting provider detail, and disclose the scope, assumptions, and gaps. The user should not have to reconstruct the answer from a pile of query results.
Autonomy does not mean certainty. The agent can carry out the research steps without requiring the user to direct every query, while still flagging an ambiguous mapping, missing benchmark, or comparison that needs human review.
There is another boundary worth stating plainly: published negotiated rates are not proof of what a provider was actually paid. Market benchmarking and claims-based underpayment analysis answer different questions, and a credible answer should not blur them.
The profound change is who carries the analytical burden
What excites me is not replacing experienced analysts. It is making their expertise available throughout the workflow, rather than requiring a person to intervene at every turn.
A better interface helps you navigate the data. An agent with domain-specific instructions, access to the underlying database, and the ability to investigate unexpected results can take on more of the work itself.
That changes the user’s role. Instead of spending the entire process choosing filters, resolving identifiers, and deciding which query to run next, the user can focus on the business question, challenge the methodology, and decide what to do with the evidence.
The data foundation still matters enormously. But its value grows when more people can use it without having to master every reporting convention underneath it.
That is the direction we are building toward with Trek Health’s Payer Performance Platform: moving from access to information toward the capacity to act on it. For Market Intelligence, the goal is an answer a contracting or finance leader can understand, interrogate, and bring into the next conversation.
I do not think the next chapter of price transparency will be defined by how many rows someone can export. It will be defined by how much of the work between a question and a defensible answer the software can take on.
Bring a market question your team is working through. See Trek Health to explore how our Market Intelligence agents approach it.