Medicare Open Enrollment and the Shifting Reimbursement Landscape
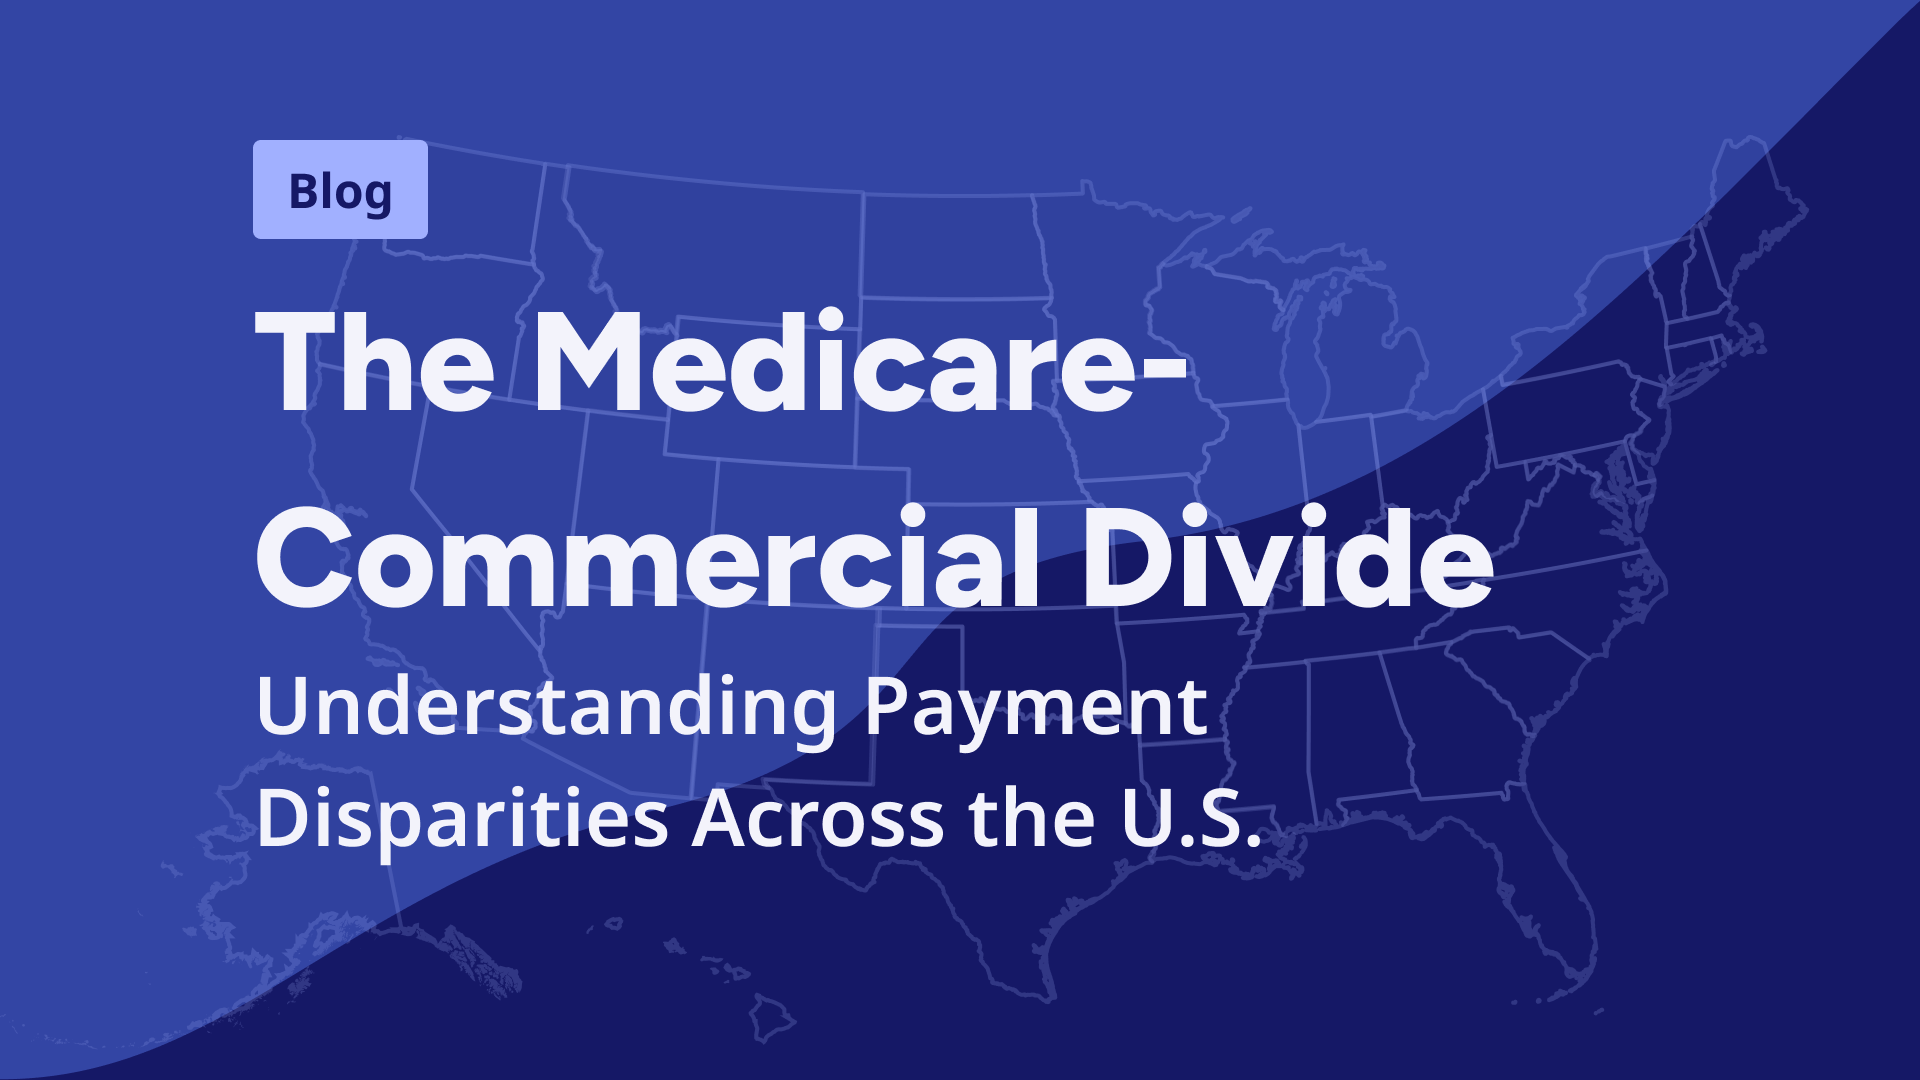
With the open enrollment period currently open for Medicare, addressing the differences in governmental versus private insurers are essential. Although Medicare patients represent a minority share of the national payer mix, they account for roughly 20% of all covered patients, a proportion that continues to rise alongside the aging American population. As the Medicare population grows, understanding how reimbursement from Medicare compares to that of commercial payers becomes increasingly important, not only for individual practices but also for health systems and policymakers seeking to balance access, equity, and financial sustainability.
A general rule of thumb is that Medicare reimburses at half that of commercial insurers. Medicare’s rates are benchmarked to national averages and updated annually with minimal regard for regional negotiation dynamics. Conversely, commercial reimbursement is market-driven, influenced by local competition, provider consolidation, and payer leverage.
This structural divergence has several implications:
- Contract Negotiation: Providers with strong commercial payer mixes can offset Medicare underpayment through strategic contracting. However, those serving older or lower-income populations face tighter margins.
- Access to Care: Persistent under-reimbursement for complex or cognitive services may discourage participation in Medicare networks, particularly in underserved areas.
- Policy Reform: The data reinforce ongoing calls for site-neutral payment adjustments, risk-adjusted E/M valuations, and regionally sensitive reimbursement models to ensure fairness and sustainability.
Methodology:
To analyze across states and specialties, we used evaluation and management (E/M) codes 99213, 99214, and 99215 to quantify these differences on an even playing field. Commercial data was pulled using Trek Health’s Price Intelligence Solution across the four top payers (Aetna, BCBS, Cigna, and UnitedHealthcare), while Medicare data was pulled from the Centers for Medicare & Medicaid Services.
National Reimbursement Trends by CPT Level
The findings highlight a consistent pattern: Medicare generally reimburses at significantly lower rates than commercial insurers, though the magnitude of that difference varies widely by both specialty and geography. At a national level, the average differences between Medicare and commercial reimbursement across all specialties are as follows:
- 99213 (-$22.38)
- 99214 (-$36.49)
- 99215 (-$49.13)
The findings show a clear trend: Medicare reimburses at significantly lower levels than commercial insurers, although the size of that gap varies by specialty and geography. Nationally, Medicare pays about $22 less for 99213, $36 less for 99214, and $49 less for 99215 compared to commercial rates.
These figures indicate a progressively widening gap as visit complexity increases. In practical terms, for a complex office visit (99215), providers receive roughly $50 less from Medicare per encounter compared to commercial payers. Over time, this disparity can amount to a significant financial impact, especially for high-volume outpatient practices or those heavily dependent on Medicare beneficiaries. This trend underscores a structural issue in the U.S. reimbursement landscape: Medicare’s standardized payment methodology, while consistent and predictable, does not fully account for regional cost variations or commercial market pressures that often drive higher private-payer rates.
Specialty Variation: How Medicare's Uniform Approach Yields Unequal Impacts
Unlike commercial payers, Medicare does not differentiate by specialty, allotting one pay rate per billing code throughout a geographic region. Because of this, high-acuity and cognitive specialties, where the complexity of care, longer encounter times, and coordination burdens are not adequately reflected in Medicare’s fee schedule.
Specialties with the Largest Gap from Medicare:
- Medical Oncology (-$56.61)
- Emergency Medicine (-$53.05)
- Neurosurgery (-$48.16)
Specialties with the Smallest Gap from Medicare:
- Dermatology (-$19.91)
- Ophthalmology (-$14.77)
- Psychiatry (-$12.89)
Geographic Patterns: A Fragmented Landscape
When comparing data across all states, reimbursement disparities become even more complex.
States with positive margins often occur in markets with historically low commercial payer rates or high Medicare participation, where competition among insurers and cost-containment strategies drive down private-payer reimbursement.
States with Greatest Positive Margins:
- Alabama (+$14.36)
- Mississippi (+$12.89)
- Louisiana (+$8.62)
- Texas (+$3.11)
- Florida (+$0.36)
In contrast, states with substantial negative differentials typically feature higher cost structures and more fragmented payer markets. In these regions, commercial insurers pay substantially more to remain competitive, while Medicare’s national fee schedule does not fully adjust for local economic realities.
States with Greatest Negative Margins:
- Alaska (-$144.51)
- Minnesota (-$142.40)
- Wisconsin (-$118.35)
- New Hampshire (-$117.69)
- Oregon (-$112.14)
The result is a geographically uneven reimbursement environment, where the same service can generate markedly different financial outcomes depending on state and payer mix.
Quantifying the Impact
On average, the gap between Medicare and commercial reimbursement for E/M services ranges from $20 to $50 per visit. Over the course of a year, these differences represent millions in unrealized revenue across large provider groups or integrated delivery networks. Aligning payer-mix strategy, contract negotiations, and service delivery models with these insights can help mitigate revenue pressures and sustain access to care in an increasingly cost-constrained system. Ensuring each patient’s equitable access to healthcare starts with ensuring equitable reimbursement. With such vast differences across reimbursement modalities, it can change the trajectory of overall revenue when compounded over thousands of procedures, visits, and providers. For managed care leaders, balancing these priorities is imperative to sustain both profitable and ethical care.
A clear understanding of payer-level reimbursement disparities is one of the most powerful tools a provider organization can bring to the payer negotiation table. By quantifying the exact dollar differences between Medicare and commercial rates at the CPT, specialty, and market level, leaders can walk into negotiations with concrete evidence demonstrating where current contracts fall short, which high-volume codes are undervalued, and how those gaps translate into real revenue loss. It also supports a more intentional payer-mix strategy by clarifying which contracts create margin and which introduce financial risk, enabling more intelligent forecasting and service-line planning. As costs rise, visibility into these gaps is essential to protecting margins through targeted contract adjustments and more accurate budgeting. Taken together, these insights turn reimbursement variation into a strategic advantage, helping leaders negotiate more effectively, allocate resources with precision, and maintain sustainable financial performance in a constrained environment.
Appendix
Contact Trek Health for all specialty- and state-specific data.