
Inside Rate Change: Track Shifts. Spot Leverage. Negotiate Smarter.
Inside Rate Change: Track Shifts. Spot Leverage. Negotiate Smarter.
In today’s reimbursement landscape, knowing the rate is only part of the equation. Understanding how it’s changed and why is where the real leverage lives.
That’s where Rate Change comes in. As part of Trek’s platform, the Rate Change module helps provider organizations monitor payer behavior over time, quantify shifts in negotiated rates, and anticipate what’s coming next.
If our Competitive Market Analysis (CMA) tells you where you stand, Rate Change shows you how you got there — and where you might be heading.
What Is Rate Change?
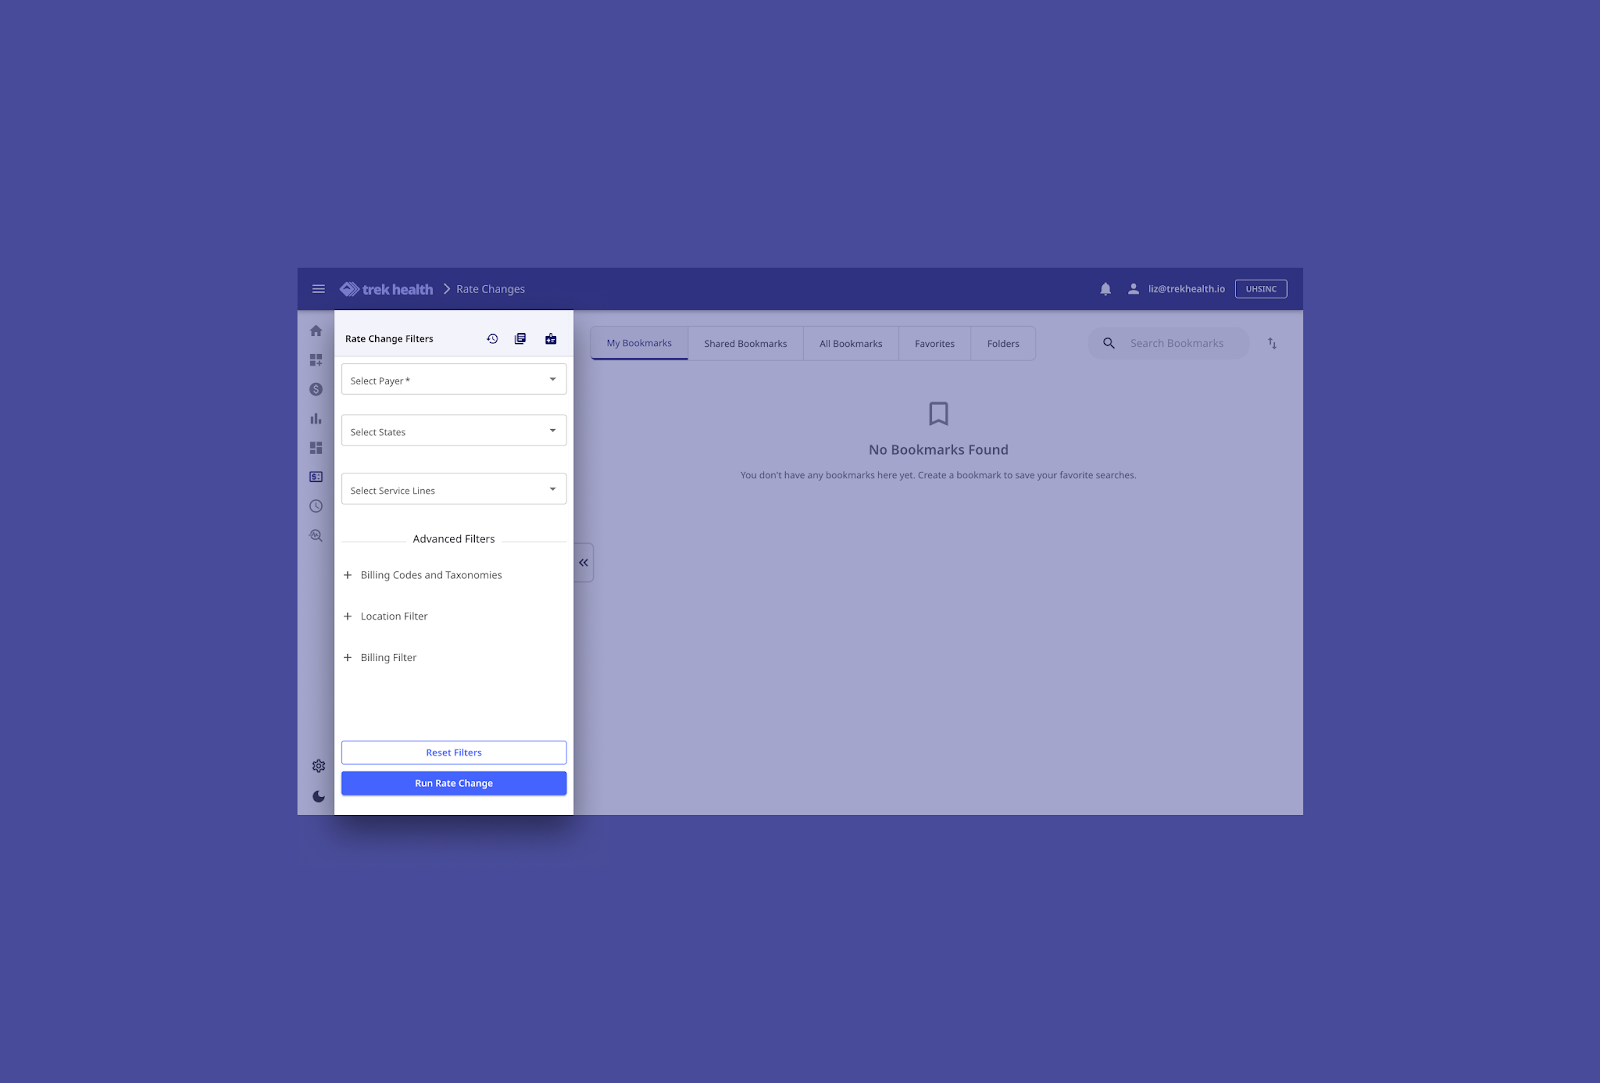
Rate Change is Trek’s interactive report that shows payer rates over time quarter by quarter. It empowers health systems to track reimbursement dynamics quarter-over-quarter across both their own contracts and the market at large.
Whether you’re preparing for a negotiation, identifying outliers, or watching for signs of margin erosion, Rate Change gives you the tools to act with confidence.
What You Can Do With Rate Change
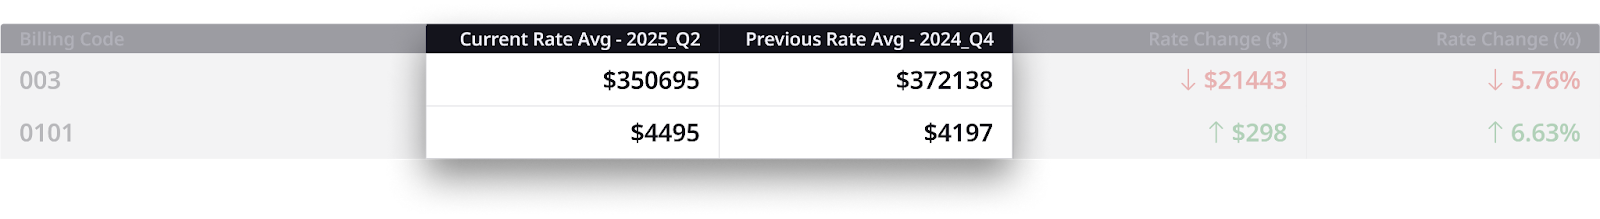
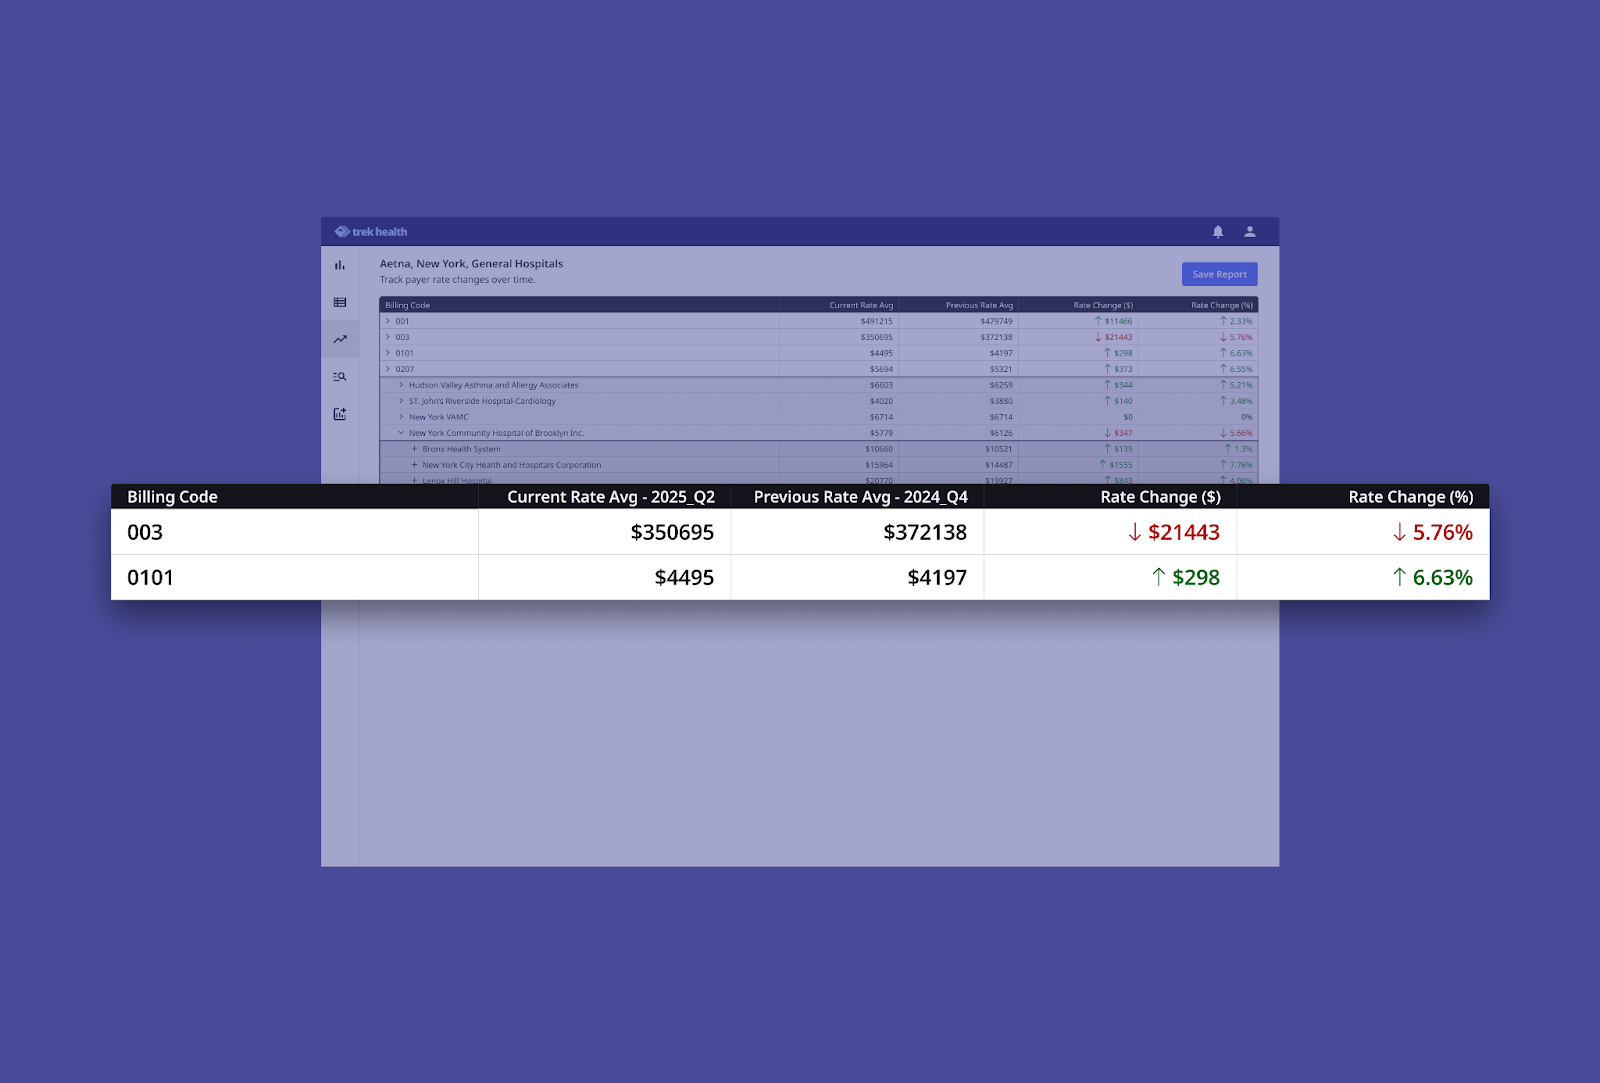
- Historical Rate Comparison
View current vs. prior rates side by side—by billing code, payer, and organization.
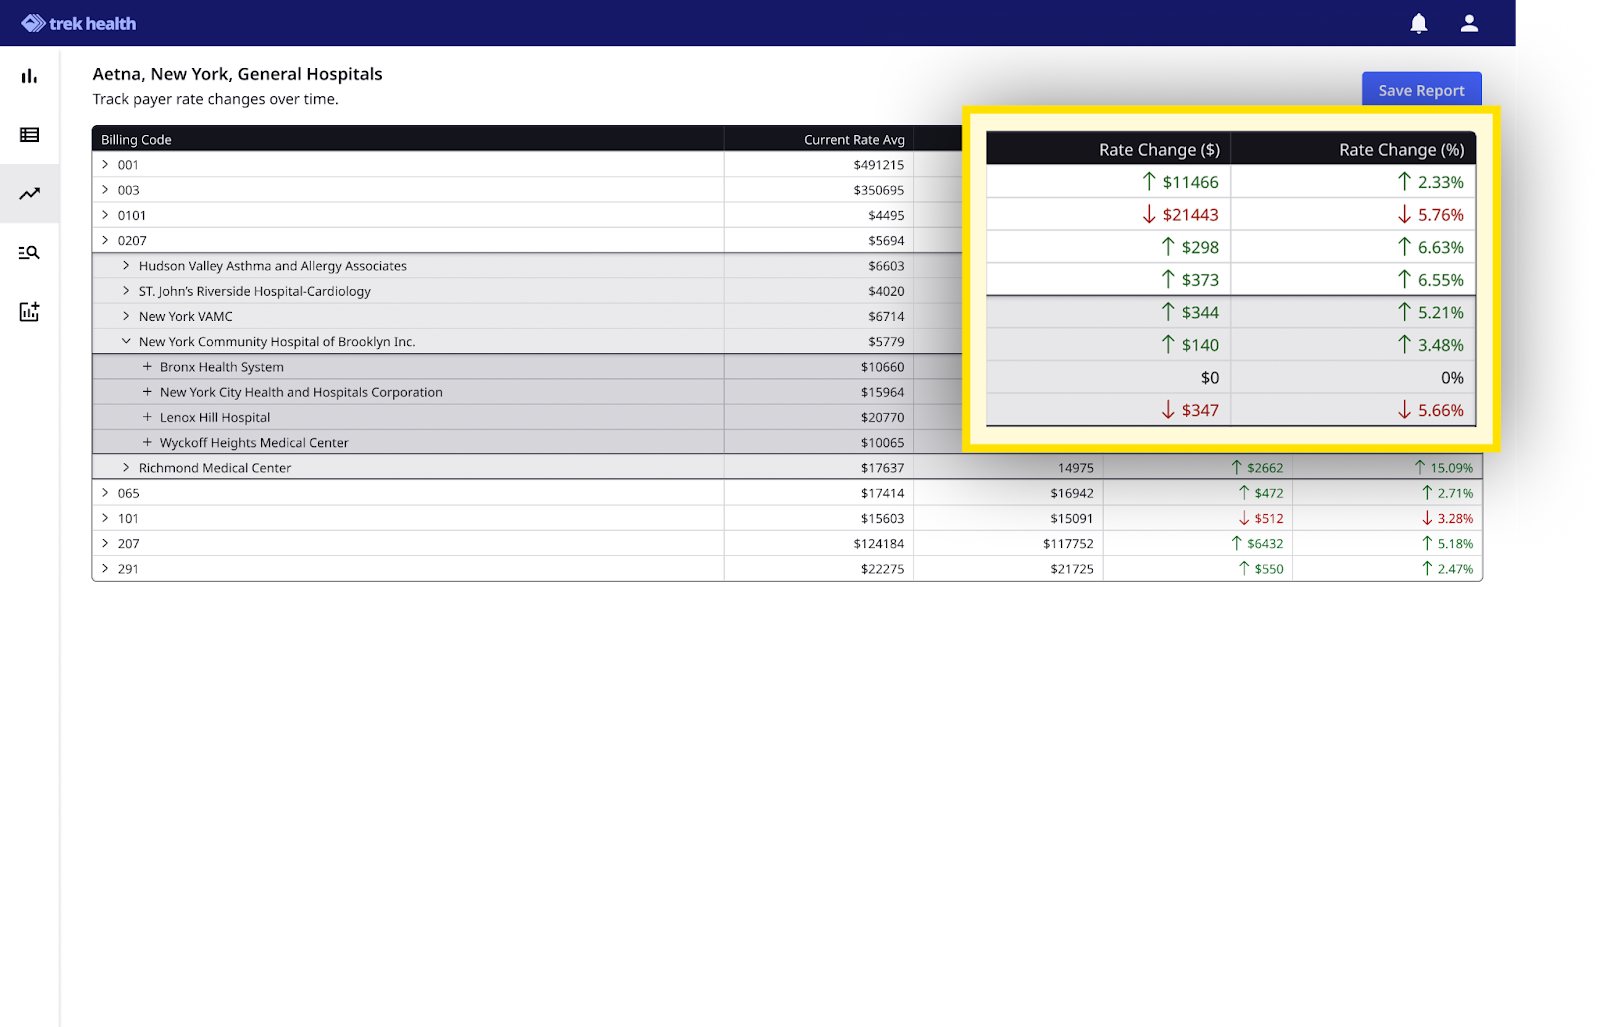
- Rate Change Metrics
Automatic $ and % shift calculations, with clear visual indicators:
Green arrow = favorable change for the provider
Red arrow = unfavorable change for the provider
- Drill-Down Navigation
Click from billing code → provider org → individual provider to trace changes with full transparency.
- Quarterly Tracking
Stay ahead of trends with updates every quarter, perfect for pacing strategy in real time.
- Custom Filter Views
Filter by billing code, taxonomy, NPI, TIN, payer, and geographic region to zoom in on what matters most to your team.
Real Strategy. Real Leverage.
Rate Change isn’t just about historical data, it’s about using history to drive better decisions.
In a transparency-driven era, staying reactive isn’t enough. You need to anticipate rate movement, track payer-specific behavior, and spot anomalies early, before they show up in margin reports.
With Rate Change, providers can:
- Equip teams with clear proof points for negotiation
- Monitor reimbursement shifts before they impact margins
- Track payer-specific behavior over time
- Spot emerging patterns by region, organization, and service line
- Build a stronger, data-driven contract strategy
Want to See It in Action?
Explore Rate Change live. Book a demo today.
And follow Trek Health on LinkedIn to keep up with the latest in pricing strategy, transparency, and smart contracting.
.png)
White Paper
From Transparency to Prediction: Quantifying the Drivers of Physician Reimbursement Variation
This analysis uses Transparency in Coverage data to model how payers behave, not just what they pay. By linking reimbursement rates to physician characteristics, we uncover the patterns behind payment variation and transform transparency data into predictive intelligence. The result: a predictive view of rate dynamics that helps stakeholders anticipate trends and negotiate with data-driven confidence.
White Paper
Q1 2026 State of Commercial Reimbursement: Trek Health’s Quarterly Market Intelligence
As Trek Health's Quarterly Market Intelligence series matures, more longitudinal trends are emerging. After a brief period of stabilization in late 2025, Q1 2026 brought renewed payer pressure across specialties, geographies, and major national payers. Trek Health's latest Quarterly Market Intelligence report breaks down exactly what shifted — and what it means for your contracts.
Want to see how these trends affect your market? Speak to our team.
White Paper
Q3 2025 State of Commercial Reimbursement: Trek Health’s Quarterly Market Intelligence
Trek Health’s Quarterly Reimbursement Brief highlights emerging variability in commercial payment rates across U.S. payers, specialties, and geographic markets. With some segments experiencing double-digit growth and others notable declines, contracting performance is increasingly shaped by real-time payer behavior rather than historical norms. Through validated reimbursement trend analytics, contract intelligence, and policy monitoring, Trek equips provider organizations to anticipate market shifts, protect revenue, and negotiate with measurable leverage.
White Paper
Q4 2025 State of Commercial Reimbursement: Trek Health’s Quarterly Market Intelligence
Trek Health’s Q4 2025 Quarterly Market Intelligence report analyzes quarter-over-quarter commercial reimbursement movement across national payers, physician specialties, and U.S. states. While overall reimbursement improved following earlier declines, rate changes remained uneven—highlighting payer selectivity, persistent specialty outliers, and shifting geographic leverage. This report moves beyond static benchmarks by tracking real-time reimbursement changes, giving provider organizations actionable insight to identify negotiation risk early, protect rate parity, and respond proactively to evolving payer behavior.
White Paper
Reimbursement and Reality: The Economics of Breast Cancer Treatment
While breast cancer awareness efforts often focus on screening and treatment, one critical factor remains overlooked: how care is reimbursed. Payment structures shape far more than provider margins; they influence access, equity, and patient outcomes.
In this analysis of payer rates, Trek Health uses its Transparency Platform to analyze how reimbursement for breast cancer care varies across geography, commercial payer behavior, and public policy. The findings reveal a system that rewards disease burden rather than prevention which creates inequities that ripple through the entire care process.
Inside you’ll learn:
- How reimbursement rates differ dramatically by state and payer
- Why higher disease burden correlates with higher payment, but prevention does not
- What these trends mean for provider strategy, patient access, and equity
Download the full analysis to see how transparency data can help reshape breast cancer care—turning financial insight into fairer outcomes.
White Paper
Telehealth Parity: Are You Getting Reimbursed When Doing What’s Right for the Patient?
Telehealth reimbursement fell below in-office rates in 98% of observations across major commercial payers for established patient visits. State parity laws showed no association with improved commercial reimbursement equity, a finding explained in part by ERISA preemption of self-funded employer plans.
Read the full analysis for payer-level breakdowns and implications for federal policy.
White Paper
The Cost of Policy Drift: A Framework for Measuring and Managing Payer Policy Lag as an Operational Risk
Commercial payers change coverage criteria, prior authorization requirements, and coding guidelines continuously and without standardized notice, leaving provider organizations to detect, interpret, and operationalize each update on their own. The lag between when a payer changes a rule and when that change is fully reflected in an organization's workflows is a distinct, measurable operational risk we term Policy Drift. Left unnamed and unmeasured, Policy Drift generates denial volume, prior authorization friction, fee schedule underpayment, and audit exposure that most organizations misattribute to clinical or documentation failure.
This paper introduces a four-stage latency framework for decomposing Policy Drift into its constituent components, a KPI set for tracking it, and the infrastructure requirements for closing it systematically.
White Paper
The Economics of Payer Contract Management Automation: Quantifying Cost Savings & Revenue Lift
Trek Health's Contract Intelligence (CI) automates contract interpretation and policy maintenance, transforming unstructured payer data into actionable rules. Using industry benchmarks and multi-scenario modeling across clinic, multispecialty, and hospital environments, CI generates annual savings ranging from $80K to over $9.3M, driven by avoided denials, reduced administrative labor, and streamlined policy-update workflows. Our results show that CI functions as core financial infrastructure rather than a point solution, delivering structural value across the reimbursement lifecycle.
White Paper
The Payer Paradox: When Higher Rates Don’t Mean Higher Reimbursement
This analysis uncovers a critical paradox in commercial healthcare financing: the payers offering the highest contracted rates often deliver the lowest realized reimbursement once denials and administrative friction are accounted for. By introducing the Payer Generosity Index (PGI) and adjusted PGI (aPGI), Trek Health reveals how payer performance varies not only across insurers, but across specialties and service lines. These findings equip healthcare organizations with a clearer, data-driven framework for contracting, revenue optimization, and strategic planning in an increasingly complex reimbursement landscape.
White Paper
The Private Practice Playbook: Rate Negotiation Index Rankings for Specialty-Specific M&A Strategy
Physician economics are shifting as private equity and independent platforms redefine the workforce landscape. Trek Health’s Rate Negotiation Index Report quantifies the return on physician labor across states and specialties in a new lens: combining commercial reimbursement, physician salary, malpractice risk, and provider density into a single metric. This data driven foundation for smarter M&A strategy identifies the most economically sustainable opportunities across the U.S. for physician recruitment and network expansion.
Inside Rate Change: Track Shifts. Spot Leverage. Negotiate Smarter.
In today’s reimbursement landscape, knowing the rate is only part of the equation. Understanding how it’s changed and why is where the real leverage lives.
That’s where Rate Change comes in. As part of Trek’s platform, the Rate Change module helps provider organizations monitor payer behavior over time, quantify shifts in negotiated rates, and anticipate what’s coming next.
If our Competitive Market Analysis (CMA) tells you where you stand, Rate Change shows you how you got there — and where you might be heading.
What Is Rate Change?
Rate Change is Trek’s interactive report that shows payer rates over time quarter by quarter. It empowers health systems to track reimbursement dynamics quarter-over-quarter across both their own contracts and the market at large.
Whether you’re preparing for a negotiation, identifying outliers, or watching for signs of margin erosion, Rate Change gives you the tools to act with confidence.
What You Can Do With Rate Change
- Historical Rate Comparison
View current vs. prior rates side by side—by billing code, payer, and organization.
- Rate Change Metrics
Automatic $ and % shift calculations, with clear visual indicators:
Green arrow = favorable change for the provider
Red arrow = unfavorable change for the provider
- Drill-Down Navigation
Click from billing code → provider org → individual provider to trace changes with full transparency.
- Quarterly Tracking
Stay ahead of trends with updates every quarter, perfect for pacing strategy in real time.
- Custom Filter Views
Filter by billing code, taxonomy, NPI, TIN, payer, and geographic region to zoom in on what matters most to your team.
Real Strategy. Real Leverage.
Rate Change isn’t just about historical data, it’s about using history to drive better decisions.
In a transparency-driven era, staying reactive isn’t enough. You need to anticipate rate movement, track payer-specific behavior, and spot anomalies early, before they show up in margin reports.
With Rate Change, providers can:
- Equip teams with clear proof points for negotiation
- Monitor reimbursement shifts before they impact margins
- Track payer-specific behavior over time
- Spot emerging patterns by region, organization, and service line
- Build a stronger, data-driven contract strategy
Want to See It in Action?
Explore Rate Change live. Book a demo today.
And follow Trek Health on LinkedIn to keep up with the latest in pricing strategy, transparency, and smart contracting.