In the same U.S. city, a routine 30-minute office visit was billed at $101 by one health system and $660 by another.
Same CPT code. Same city. Same service.
So what explains a 550% price difference?
The answer lies in a growing challenge for hospitals and health systems: lack of visibility into payer reimbursement rates.

Why Health Systems Must Prioritize Payer Rate Benchmarking
Many hospitals have little to no insight into how much payers are reimbursing competitors for the same services. Without proper payer rate benchmarking, health systems are operating with blind spots, leaving significant revenue on the table.
Common challenges include:
- No access to external reimbursement benchmarks
- Limited analysis of local payer-negotiated rates
- Inability to identify underperforming service lines
- Minimal use of Transparency in Coverage (TiC) data
This is a critical issue in a value-driven market. Without proper healthcare price transparency, hospitals can’t effectively negotiate, optimize, or grow.
Trek Health: Turning Compliance Data Into Competitive Strategy
At Trek Health, we work exclusively with health systems, not payers, to help them unlock the full strategic value of TiC data.
Using our proprietary tools, we turn massive, messy data sets into powerful insights that help hospitals:
- Identify where they’re underpaid compared to local competitors
- Benchmark their reimbursement rates by CPT or DRG code
- Visualize performance with interactive service line heat maps
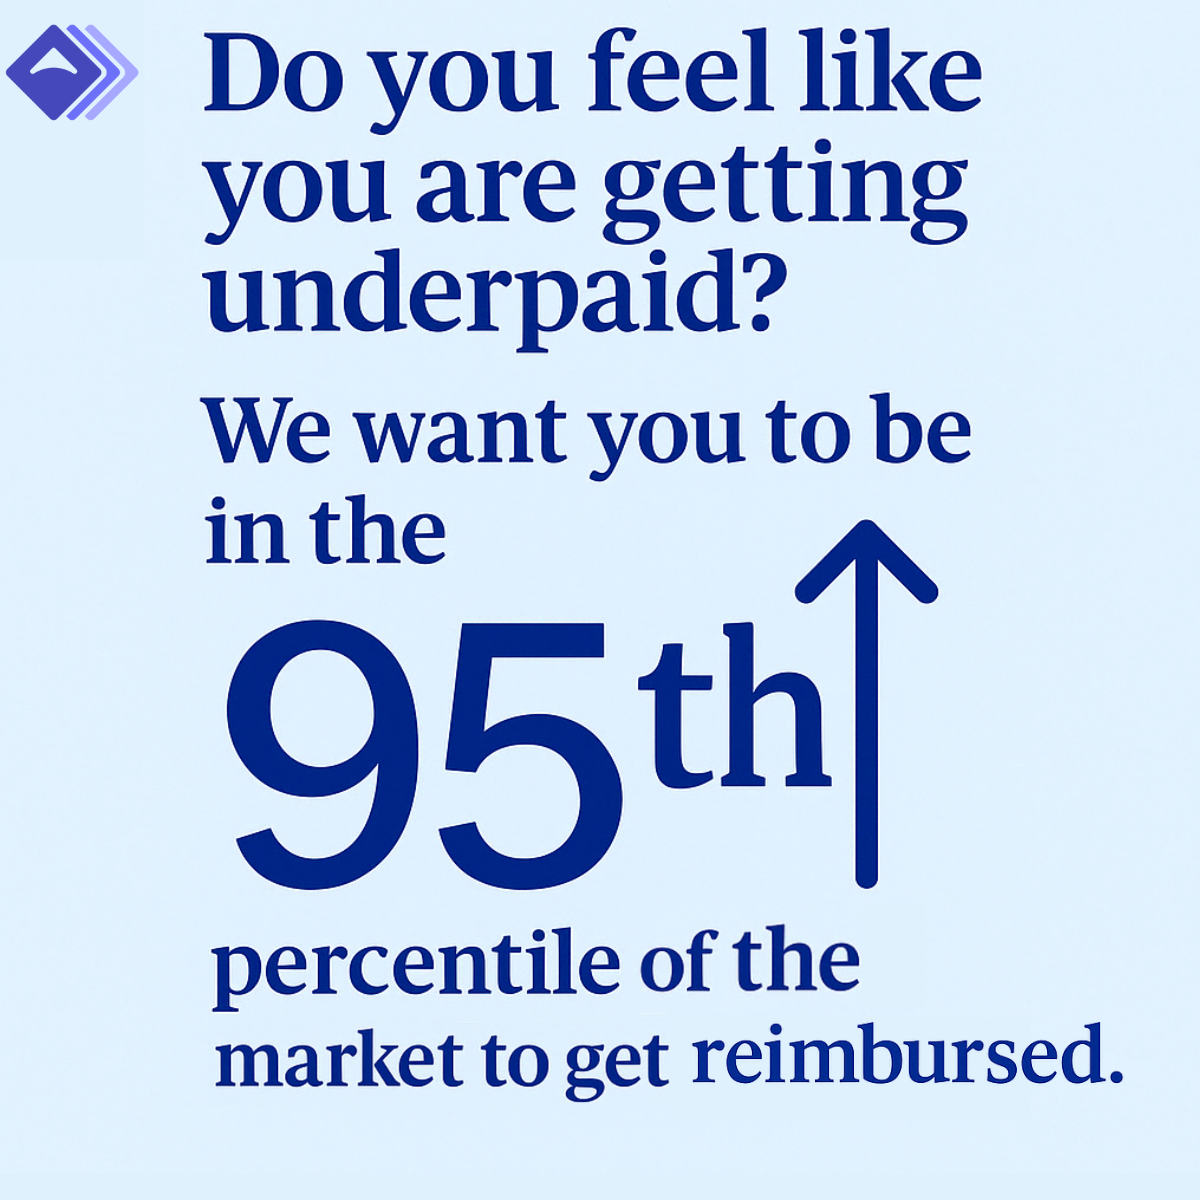
- Target the 95th percentile of the market for optimal reimbursement
And most importantly: we never share your data with payers. Our allegiance is 100% with provider organizations.
From Transparency in Coverage Compliance to Financial Opportunity
CMS regulations around price transparency were intended to empower providers and patients with greater visibility. But publishing machine-readable files isn’t enough.
The real opportunity comes from analyzing those files—across payers, markets, and service lines and turning them into a roadmap for stronger revenue performance.
Hospitals that treat TiC data as a strategic asset rather than a compliance burden are outperforming their peers in payer negotiations.
Do You Know Where You Stand?
If your health system isn’t benchmarking against the market, you're likely underpaid and unaware of it.
Let Trek Health help you:
- Close reimbursement gaps
- Strengthen your payer strategy
- Get paid what you deserve for the care you deliver
Schedule a strategy call today to see how your rates compare and how to fix them.